


Abstract
Background: Underemployment is a reality for many new graduates, who accept locum or part-time work as an alternative to unemployment because of lack of opportunities. We sought to analyze orthopedic surgeons’ Ontario Health Insurance Program (OHIP) billing data over a 20-year period as a proxy of practice patterns and hypothesized that billing in the first 6 years of practice would be affected by underemployment and locum.
Methods: We analyzed the annual average billing totals of orthopedic surgeons, broken down by year of graduation, year of billings, and number of surgeons billing in that year. We analyzed public census data of the Ontario population size as a proxy of orthopedic demand.
Results: A 2019 cross-sectional analysis showed that around 15 surgeons per graduating year were billing in Ontario from the 1995 to 2016 cohorts, while 2017 and 2018 saw an increase to 30 and 36 actively billing surgeons, respectively. The number returned to more historical numbers in 2019, with 20 actively billing surgeons. For those surgeons billing in Ontario, billing trends have been roughly stable, with average billings increasing each year for the first 6 years in practice (p < 0.001). Year of graduation did not have an effect on the first 6 years of billings (p > 0.5). Billings were stable after 6 years in practice (p > 0.09).
Conclusion: The Ontario health care system has not expanded to support more orthopedic surgeons despite the aging and growing population; despite our growing population, the number of surgeons being trained and retained has not matched this growth. Further research needs to be done to guide optimal health human resource decision-making.
Establishing a career after training is challenging and stressful for many new surgeons. Challenges may include seeking employment, relocating, and setting up a new practice. Underemployment is a reality for many recent graduates, who then accept locum or part-time work as an alternative to unemployment because of a lack of opportunities.1 In Canada, those in neurosurgery, radiation oncology, and orthopedic surgery have faced the most difficulty finding employment.2 From 2011 to 2018, 37% of orthopedic surgeons had not found stable employment at the time of certification. Given this delay, many have turned to other forms of work as a temporary solution. In 2012, almost 22% of new graduates reported multiple locum or part-time positions, implying delayed time to reach full employment — that is, in their own practice, working full time.1
One potential factor contributing to this difficulty for early-career surgeons is a mismatch between physician supply and capacity. Recently, the physician workforce has grown more quickly than the general population, with a 3.8% increase in the number of physicians between 2017 and 2018, compared with a population growth rate of 2.6% between the first quarter of 2017 and the last quarter of 2018.3,4 When looking at more recent data, Canada’s population grew by 1% from the beginning to end of 2021, while the physician workforce grew by 2% (1.2% for family physicians and 2.8% for specialists).4,5 Despite recent growth, Canada ranks twenty-fifth out of 35 Organisation for Economic Cooperation and Development countries, with an average of 2.8 physicians per 1000 inhabitants6 The average number of physicians per 1000 inhabitants for the 35 OECD countries was 3.2. It is estimated that 2.3 million people in Ontario are without family physicians,7 and yet 268 residency spots for family medicine were unfilled in 2023.8 The juxtaposition of underemployed graduates with a low number of physicians per capita is owing to severe underfunding of the system rather than an oversupply of physicians.
The topic of unmet orthopedic demand has been previously studied, demonstrating that Ontario, the largest province in Canada, has half the estimated surgeons per 100 000 population required to meet demand.9,10 This has led to wait times being a critical advocacy point by the Canadian Orthopaedic Association.11,12 Wait times are particularly challenging for patients needing to undergo hip and knee replacement. A recent study showed that patients who wait more than 6 months for hip and knee arthroplasty experience a significant decrease in quality of life and increase in frailty.13 Ontario has set a quality-based procedure target of 6 months for hip and knee replacements. Ontario’s own targets for knees are met only 60% of the time, with an average wait time of 189 days, and targets for hips are met 64% of the time, with an average wait time of 156 days.14 Performance varies substantially within the province, with our institution — University Hospital, London Health Sciences Centre — meeting targets for knee arthroplasty 32% of the time (average wait 402 d), and targets for hip arthroplasty 25% of the time (average wait 390 d).14 This is a large academic centre in a major urban centre. These data make it clear that patients are not getting the care they need when they need it. Although orthopedic care encompasses more than hip and knee arthroplasty, this is a salient point for many patients and is a proxy of the difficult access to orthopedic services.
To have meaningful discussion on physician workforce planning, the investment made by the public to train new orthopedic surgeons in a publicly funded system must also be accounted for. At an approximate public cost of $780 000 to train a specialist, understanding the orthopedic workforce may also offer insight into the millions of dollars spent training these specialists and whether they are being used effectively after their training is completed.15
Recent analysis of changes in surgical practice patterns is lacking. Chan and colleagues16 examined practice profiles of older Ontario physicians based on Ontario Health Insurance Plan (OHIP) billings, with an identified cohort of 2055 physicians aged 65 years and older, followed from 1989 to 1996. Older physicians were overrepresented in surgical specialties, pediatrics, and diagnostic imaging, and among specialists in rural areas. Many older physicians had reduced workloads, with 60% working part time. Older family physicians were less likely to work in obstetrics and emergency medicine, participated in more operations as surgical assists, and treated an older patient population. These findings demonstrated the areas of practice that younger physicians needed to absorb over time to provide comprehensive patient care.
Health human resource planning is a complex process involving multiple factors where a single solution may not work for everyone; objective data may be an important tool to understand the evolution of surgical practice patterns. An analysis of practice patterns showing how these patterns have changed over the last 20 years could help surgical trainees prepare for their careers, and guide health care policy and planning.
The primary objective of this study was to determine how the first 6 years of orthopedic surgeons’ billings have changed in the last 20 years. Secondary objectives were to determine whether billings changed after 6 years of practice and how the number of physicians in practice has changed over time.
Methods
We analyzed average yearly OHIP billings in orthopedic surgery, submitted to the Ontario Ministry of Health from 1989 to 2019. These billings were adjusted to the consumer price index of 2018. We analyzed the number of surgeons billing each year and the average fees billed per year by year of graduation. We used a linear regression model to analyze average yearly billings as a function of year of residency graduation. We split data into early career years, namely the first 6 years in practice, and 6 or more years.
We used the Canadian Post-MD Education Registry (CAPER) to determine the number of orthopedic surgeons who finished residency training in Ontario each year from 1989 to 2017. We used residency positions on the Canadian Resident Matching Service (CaRMS) from 2013 to 2021 as a rough proxy of future surgeon output. Data were analyzed using SPSS.
Results
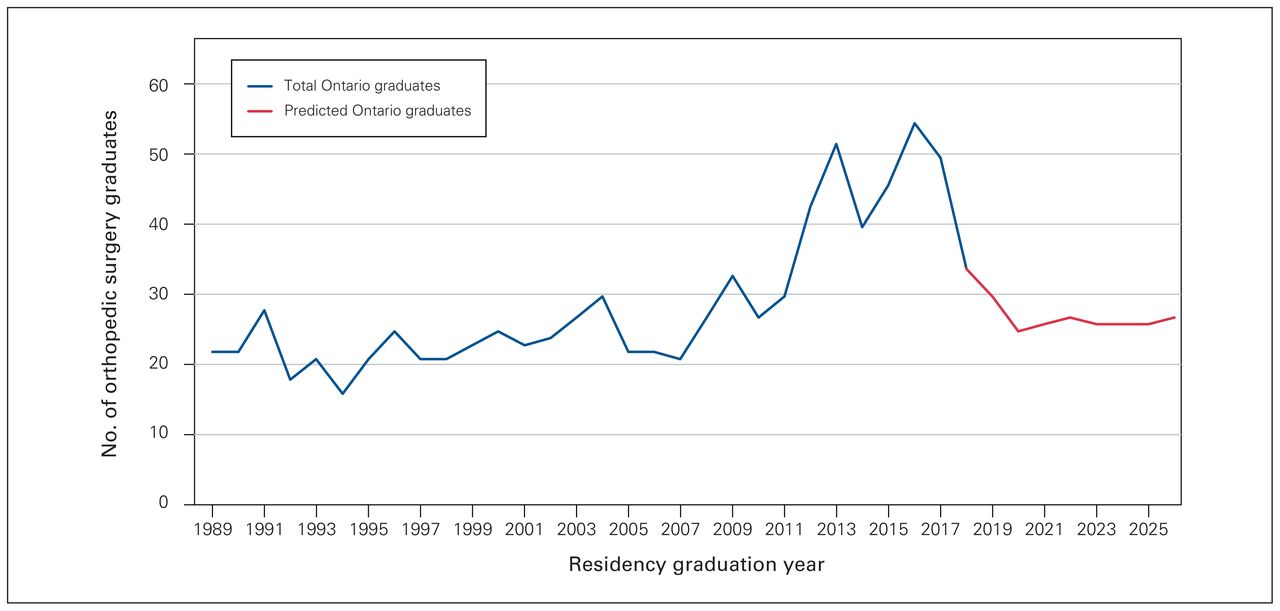
From 1989 to around 2011, the number of orthopedic surgeons who completed their training in Ontario ranged from 15 to 30 surgeons per year. From 2012 to 2016, the number of surgeons graduating from Ontario institutions increased steadily, with a peak of 55 residents graduating in 2016 (Figure 1). There appears to have been a sharp reduction in the number of residency spots available after 2016, with 27 orthopedic residency spots available in Ontario in 2021, projecting a maximum of 27 graduates from Ontario institutions in 2026. (Figure 1). The overall number of orthopedic surgeons with OHIP billings increased overall from 1993 to 2021 (Table 1).

Number of orthopedic surgery graduates in Ontario by residency graduation year, from the Canadian Post-MD Education Registry data set, and predicted number of graduates, calculated by looking at the number of filled orthopedic surgery residency spots in a given year, and adding 5 years to it.
Number of orthopedic surgeons with Ontario Health Insurance Plan (OHIP) billings each year, and the change from previous year
When looking at actively billing surgeons in Ontario, a cross-sectional analysis in 2019 showed an average of 15 (range 10–20) surgeons billing the Ministry of Health per year of residency graduation from 1995 to 2016. There was an increase in 2017–2018, with a peak of 36 surgeons who finished residency in 2018 (Figure 2). Figure 2 shows the number of actively billing surgeons in Ontario by year of residency graduation.

Number of orthopedic surgeons billing in Ontario in 2019 as a function of year of residency graduation.
The number of actively billing surgeons and trained surgeons diverged from 2007 to 2018. This can be seen by comparing Figure 1 and Figure 2 (Figure 3).

Number of orthopedic surgery graduates and orthopedic surgeons who were actively billing in Ontario, by residency graduation year, demonstrating a divergence from 2007 to 2018 between the number of actively billing surgeons and the number of trained surgeons in Ontario.
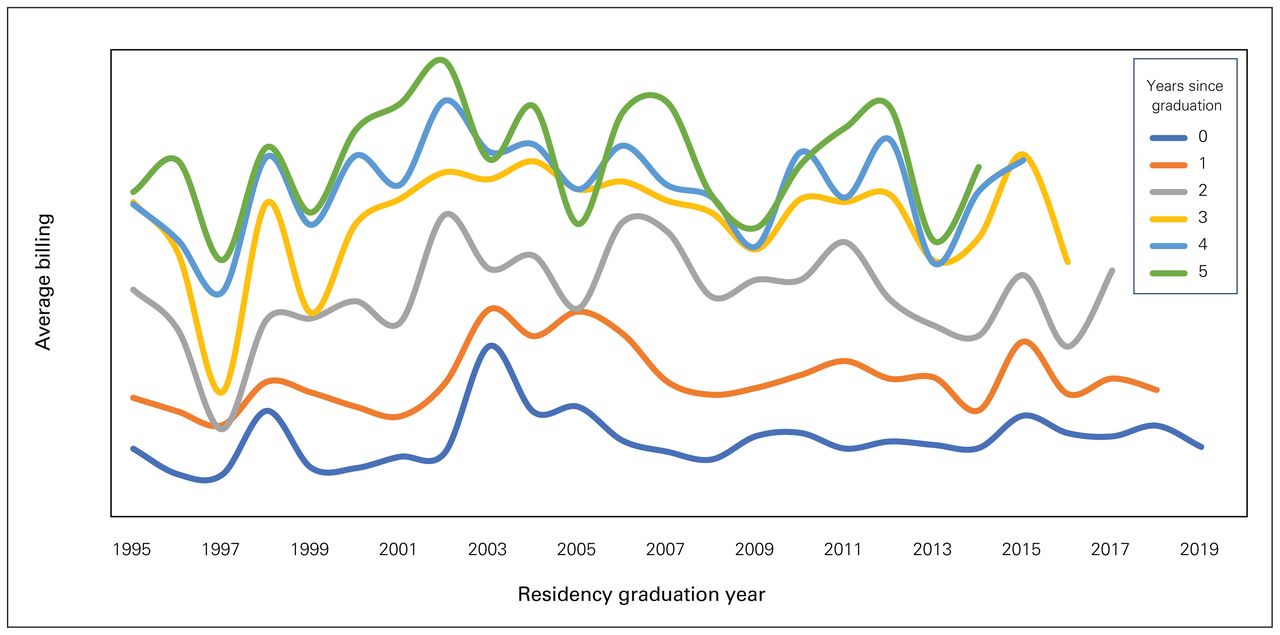
Within the first 6 years of practice, we observed a statistically significant increase in income, adjusted for inflation, for each year in practice (p < 0.001). There was no effect of year of graduation (p = 0.5) (Figure 4). Income did not increase after 6 years of practice (p = 0.09).

Average yearly billing in the first 6 years of practice grouped by 5-year intervals of graduation. Y-axis is average fee-for-service billing; we chose to not display absolute numbers so as to not shift the focus of the paper on the amount billed.
Discussion
The most striking finding in this study was the asynchrony in orthopedic surgeon supply and new surgeons starting to bill in Ontario. There appeared to have been an attempt to increase supply between 2012 and 2016 without a synchronized match in new surgeons’ billings. This can understandably lead to stressors for new graduates owing to the scarcity of opportunities. We can assume that graduates at that time may have made decisions that they would not have otherwise made. Some of these graduates may have had to emigrate to another province or another country. For those who were able to secure employment in Ontario, they may have accepted a position in a subspecialty or location that they would not have otherwise chosen — these are areas for further research.
Certainly, we can appreciate a lag in surgeon output as the increase in new surgeons graduating from 2012 to 2016 reflects decisions made around 2007 to 2011, given orthopedic surgery is a 5-year program. As such, it would be interesting to understand the rationale that led to these initial decisions to increase the number of training spots for more surgeons and then the reason to cut that number back so quickly, a decision that would have an acute effect on the transition from medical school to residency.17–19
We observed that the average billings in the first 6 years of orthopedic practice have not changed in the last 20 years, which was an unexpected finding. Given the reports of underemployment, we expected a decrease in productivity in more recent years as new graduates undertake further subspecialization.2 Younger graduates seem to have similar billing patterns to older graduates. With that being said, billings tell only part of the story. More recent graduates may have similar billings to their predecessors, but they may be accomplishing this by doing more overnight and weekend work (which pays after-hours premiums), fellowships (in which they can bill as surgical assistants), or unscheduled surgeries during locums, given that billing histories do not equate to insight on full-time employment. Regardless, we found that those who were billing in Ontario — whether they had secured full-time employment or not — did not have a financial disadvantage in terms of fee-for-service billings.
Our data suggest that, on average, 15 (± 5) new orthopedic surgeons are added to the Ontario workforce each year, a number that has been relatively stable in the last 20 years with the exception of a slight peak in 2018 with 36 surgeons. Since 1993, the number of orthopedic surgeons with OHIP billings appeared to increase steadily. When viewed in the context of the number of surgeons per graduating year, which has mostly stayed the same, a few interpretations are possible. For instance, surgeons may not be retiring and leaving practice, fellows without full-time employment may be contributing to billings, or surgeons who practised outside the country or province may have returned to Ontario. These could account for the variations, with some years seeing a decrease in the orthopedic surgeon pool in Ontario, an area of potential future research.
The aging population in Ontario implies an increased demand for orthopedic services. Our data suggest that, for a brief period of time, the number of training spots increased to support this need. However, health care system funding did not appear to match this increase, leading to wasted public resources for training, potentially increased stressors for graduating surgeons, and lack of full retention of these highly trained and valuable resources for the province.
Limitations
We used average billing data in Ontario, which can lead to potential confounders and limit generalizations. As such, we could not extrapolate the degree of employment of individual surgeons. A more recent graduate could be billing in a similar manner in their first 5 years after graduating residency as their predecessors, but doing so through locums, surgical assisting, and after-hours cases. This requires working more difficult hours or a more unstable job situation and reflects not using graduates as training intended. Therefore, using billing as a proxy for having a job may be overstating the successes of recent graduates in finding meaningful employment. Moreover, since this data set used billings in Ontario, surgeons with income from other provinces would not be captured. The data set also does not capture the number of physicians retiring from practice, as our study evaluated only a cross-section in 2019. We did not capture the dynamic changes that had occurred in previous years. Future studies involving a national data set, such as data housed at the Canadian Institute for Health Information, can be considered. Overall, the purpose of our analysis was to add to our understanding of health human resource planning and spur further discussion and research.
Another limitation is with CAPER data, which show only the year a trainee finished their training. There may be fluctuations from fellowships, personal leaves, graduate work, or repeating a year for a multitude of reasons. The use of CaRMS data to assess the number of trainees has similar limitations, as these show only how many residency spots there are upon matching. The ultimate number of graduates can fluctuate for the same reasons as with CAPER data, but also from trainees switching in and out of orthopedic surgery to or from other specialties.
Conclusion
Although there was an attempt to increase the number of orthopedic surgeons to serve the population of Ontario by increasing training spots, this was not followed with an increase in newly practising surgeons entering the system. As such, it appears that the asynchrony between newly graduated surgeons and capacity for them to practise led to an underemployment crisis. This appears to have been addressed by again reducing the number of graduating surgeons, rather than by increasing resources for practising surgeons to serve the patients of Ontario. As such, the delivery of orthopedic care did not see real improvement. Given the increasing age of the population, the demand for orthopedic care will likely increase substantially over the coming years, while the increasing age of surgeons and related increase in retirement will lead to a decrease in the supply. Decreasing the number of trainees rather that increasing health care funding will not help with this problem. An interesting area of future study could be an analysis of the career decisions of orthopedic graduates from 2009 to 2016, a period with substantial asynchrony between the number of surgeons being trained versus those retained and practising in Ontario. Future research should focus on matching the needs of the population to the number of trainees and the funding required for fruitful employment upon graduation.
Footnotes
Competing interests: None declared.
Contributors: Silvio Ndoja, Emil Schemitsch, Steve Papp, and Brent Lanting contributed to the conception and design of the work. Amirti Vivekanandan, Sophia Frost, and Lyn Sibley contributed to data acquisition, analysis, and interpretation. Silvio Ndoja, Amirti Vivekanandan, Sophia Frost, Emil Schemitsch, Steve Papp, and Brent Lanting drafted the manuscript. All of the authors revised it critically for important intellectual content, gave final approval of the version to be published, and agreed to be accountable for all aspects of the work.
Disclaimer: Individual-level data were obtained from the Ontario Ministry of Health and the Ministry of Long-Term Care under an agreement with the Ontario Medical Association, who provided aggregated data for this study.
- Accepted February 26, 2024.
This is an Open Access article distributed in accordance with the terms of the Creative Commons Attribution (CC BY-NC-ND 4.0) licence, which permits use, distribution and reproduction in any medium, provided that the original publication is properly cited, the use is noncommercial (i.e., research or educational use), and no modifications or adaptations are made. See: https://creativecommons.org/licenses/by-nc-nd/4.0/
In this issue

Article tools


Related Articles
Cited By...
- No citing articles found.