


Abstract
Despite important advances in the prevention and treatment of trauma, preventable injuries continue to impact the lives of millions of people. Motor vehicle collisions and violence claim close to 3 million lives each year worldwide. Public health agencies have promoted the need for systematic and ongoing surveillance as a foundation for successful injury control. Surveillance has been used to quantify the incidence of injury for the prioritization of further research, monitor trends over time, identify new injury patterns, and plan and evaluate prevention and intervention efforts. Advances in capability to handle spatial data and substantial increases in computing power have positioned geographic information science (GIS) as a potentially important tool for health surveillance and the spatial organization of health care, and for informing prevention and acute care interventions. Two themes emerge in the trauma literature with respect to GIS theory and techniques: identifying determinants associated with the risk of trauma to guide injury prevention efforts and evaluating the spatial organization and accessibility of acute trauma care systems. We review the current literature on trauma and GIS research and provide examples of the importance of accounting for spatial scale when using spatial analysis for surveillance. The examples illustrate the effect of scale on incident analysis, the geographic variation of major injury across British Columbia’s health service delivery areas (HSDAs) and the rates of variation of injury within individual HSDAs.
Despite important advances in trauma prevention and treatment, preventable injuries continue to impact the lives of millions of people. Worldwide, motor vehicle collisions and violence claim close to 3 million lives each year.1,2 Although the United States and Canada have highly developed public health programs and trauma systems, trauma is still responsible for more than 150 000 deaths and 3 million hospital admissions annually in those countries. About 30% of all years of productive life lost before age 65 are attributed to unintentional injuries and violence; this surpasses the combined losses from heart disease, cancer and stroke.3,4 Societal costs of injury-related morbidity in these countries are estimated to exceed $275 billion dollars each year.5,6
Further advances in injury control are urgently needed. Public health agencies, including the World Health Organization, the US Centers for Disease Control and Prevention, the Institute of Medicine and the Canadian Public Health Association, have promoted the need for systematic and ongoing surveillance as a foundation for successful injury control. Surveillance has been used to quantify the incidence of injury for the prioritization of further research, monitor trends over time, identify new injury patterns, and plan and evaluate prevention and intervention efforts. Refinements in injury surveillance that can discern specific risk factors amenable to intervention may represent the next important frontier in injury control.
Advances in the capability to handle spatial data, along with substantial increases in computing power, have positioned geographic information science (GIS) as a potentially important tool for understanding population health and the spatial organization of health care7,8 and for informing prevention and acute care interventions. GIS facilitates the integration of data from multiple sources; provides collection, storage and manipulation capabilities; and offers an array of tools for spatial analysis, allowing valuable insights into health data.9 We provide a review of the current literature on trauma and GIS research. In addition, we provide examples of the importance of accounting for spatial scale when using spatial analysis for surveillance — a unique methodologic issue associated with GIS analysis.
GIS in trauma research
The use of GIS in population health is widespread, and GIS and health has become a distinct research area.9 However, the capabilities of GIS have not been extensively applied in the trauma literature. A few studies examining the social or spatial aspects of trauma have employed some GIS methods for data management, geocoding, data linkage and mapping, but they have not explicitly identified themselves as GIS-based and have not fully taken advantage of the analytical capabilities of GIS. These studies link trauma data to socioeconomic information (e.g., census data) and examine the relations between family or household characteristics, socioeconomic conditions and injury. However, they only pay cursory attention to the spatial articulation of injury.10–13
Two sometimes overlapping themes consistently emerge in the trauma literature where GIS theory or techniques are relevant: identifying determinants of the risk of trauma to guide injury-prevention efforts and evaluating the spatial organization and accessibility of acute trauma care systems. The former studies assess the contributions of human and environmental factors (e.g., income, social status, education, race, employment and working conditions, social support networks, social environments, physical environments) to the risk of injury. The latter studies often draw on location–allocation approaches to examine the efficacy of existing acute care trauma systems or assess the spatial accessibility of trauma care, paying close attention to inequitable access across geographic space.
The contributions of GIS to our current understanding of the determinants associated with the risk of trauma and the delivery of acute trauma care are summarized in the next section. We also outline with examples the methodologic concerns associated with spatial analysis.
Determinants of the risk of trauma
Geography
Epidemiologic studies have examined the geographic dimensions of trauma in relation to specific population subgroups and the type of injury. Childhood injury in particular is well represented among trauma studies. Joly and colleagues14 examined the geography of injuries among pedestrians and cyclists in the pediatric population in Montréal, Quebec, that involved motor vehicles. The authors found that few high-injury census tracts were spatially concentrated. Braddock and colleagues15 studied the geographic distribution of trauma among youth aged 20 years and younger in Hartford, Connecticut. This study used the mapping capabilities of GIS to visualize the location of trauma injuries and identify 2 high-risk areas that represented 70% of all trauma events within the study region. Both studies, although effective, used very simple analytical approaches — statistical analysis of spatially aggregated data on trauma and point mapping. The study by Braddock and colleagues15 also suggested site-specific interventions, including environmental modifications and educational programs.
Societal determinants
The GIS methods can go beyond the demonstration of the associations between risk of injury and geography. They can discern specific societal factors that place subpopulations at risk. Socieoeconomic status, for instance, was found to be an important determinant of the risk of injury among Canadian children in a study that linked injury mortality data to socioeconomic status derived from census data on urban areas.16 This study confirmed a known link between socioeconomic status and injury rates and demonstrated that a 20-year trend toward decreased injury rates among more deprived populations in urban areas has recently been reversed. Although the study carefully differentiated between urban and rural areas, it did not differentiate between spatial locations and contexts. Are there, for instance, more injuries among children in families with a low socioeconomic status in northern Canadian cities? Do fewer injuries occur in families with low socioeconomic status residing in neighbourhoods with a statistically higher socioeconomic status? These are nuances that can potentially be addressed by the incorporation of spatial analysis.
Composite indicators of geography and societal factors have also been developed. Cockings and Martin17 developed a conceptual model of health events and associated outcomes in which health effects are the product of vulnerability and exposure to individual and area-level factors. Vulnerability is conceptualized as a combination of individual predisposing and behavioural factors, while exposure is a function of both environmental factors (natural, built and social contexts) and behavioural factors. Predisposing factors are individual attributes such as age, sex, race and genetics that are not modifiable, whereas behavioural factors such as lifestyle, occupation, education and income can be altered by personal choice.) The complex relation between individual and area-level determinants of injury poses an analytic challenge to trauma studies, but also illustrates the important role of the capability of GIS to handle spatial data in trauma research.
Understanding exposure and vulnerability in the context of the risk of trauma and outcome requires various individual and area-level data sources to be linked and combined. Data linkage allows researchers to better leverage existing data resources, thereby increasing their analytical possibilities.18 A number of tools and methods for data linkage are provided within GIS software packages. Geocoding, the most fundamental method, allows spatial files to be generated from nonspatial attributes based on location information such as an address or postal code.19 Geocoded data on trauma can be used to map locations where injuries occur and to then spatially link this information to other data describing the natural, built and social environments in which injuries occur.
The spatial organization of trauma care
Kivell and Mason20 suggest that timely access to trauma care can, along with accident prevention strategies, act as a means of reducing trauma-related mortality. As they point out, Trunkey21 found that when mortality from trauma is plotted by time after injury, a trimodal distribution emerges. The first peak represents deaths that occur on or immediately after injury, the second peak represents deaths that occur within the first few hours after injury, and the third peak represents deaths that occur days or weeks after injury. Kivell and Mason20 argue that the second peak includes potentially preventable deaths. They suggest immediate prehospital treatment and timely transfer (within the first couple of hours after injury) to a trauma care facility would reduce mortality in the second peak. Using a location–allocation approach in a GIS environment, the authors propose that 30 trauma systems, each with 1 trauma centre and multiple supporting hospitals, would provide optimal trauma care coverage for the United Kingdom.
Peters and Hall22 present a GIS framework for assessing ambulance response times. They draw on the capability of GIS to handle spatial data to geocode ambulance call data and link it to service territories. They analyze spatiotemporal response time to determine how well the existing ambulance services serve their catchment populations. The GIS framework presented was intended to assist planners to identify areas where response time was unsatisfactory and provide the means to investigate the possible causes of poor performance (e.g., poor spatial coverage, insufficient resources, inefficient dispatch).
The 2 emerging themes of GIS and trauma — the determinants associated with the risk of trauma and the spatial organization of trauma care systems — remain underdeveloped.
Important research on access to trauma facilities and the relative cost–benefit of trauma facilities has been conducted in the United States. MacKenzie and colleagues23 reported that in-hospital mortality is substantially lower at trauma centres than at hospitals without full trauma services. Their research indicated that the risk of death was much lower among patients who received treatment in trauma centres than among patients who did not, implying that regionalization of services continues to be important. Nathens and colleagues24 found inconsistency in the availability of trauma resources across the United States. Likewise, Branas and colleagues25 found that about 16% of the population in the United States was not located within 1 hour of a trauma facility. However, their study was based on the assumption that air transport was always available. If road travel time was used, they likely would have found a greater number of people without access to a trauma facility within 1 hour.
These studies are characterized by their use of statistical techniques rather than GIS to calculate access. In a previous study,26 we used GIS to calculate road travel times to rural hospitals. This method may prove more effective in terms of accurately estimating travel time and access.
Methodologic considerations
Examining the geographic variation of injury rates within a study region must address a number of methodologic considerations, especially when mapping rates in small areas or at the neighbourhood level.27,28 Mapping trauma events requires deciding between vector- and raster-based representation. Vector-based representation (i.e., point, line and area maps) typically use data that are already associated with predefined administrative units such as census tracts or postal codes. Vector-based GIS tends to aggregate such areal units to create incidence rate maps, while raster-based representation (grid cell maps) generally uses neighbourhood functions to create a continuous surface that shows health event density.29 Vector-based representation is commonly used in epidemiology because it allows for easy linkage and spatial aggregation of trauma events to the same areal units as census-based population data. This allows the relation between trauma and the socioeconomic, cultural and demographic characteristics of an area to be examined either visually or statistically.12–14,30–34
When mapping trauma rates using administrative or statistical areal units, one must be aware of the potential unreliability of rates derived from small numbers, as well as the impact of the modifiable areal unit problem (MAUP) on statistical results and spatial patterns.17,29,35 Unreliable incidence rates can be mitigated in trauma studies through the use of sophisticated statistical techniques such as empirical Bayesian smoothing or probability mapping.9,36 Because of the relative infrequency of trauma events, especially specific or major injury, recent trauma studies have used Bayesian analysis to stabilize mapped injury rates.37,38
The MAUP is an unresolved problem inherent to mapping and statistical analysis that uses areal data.39 Statistical results or mapped patterns derived from these data are affected by the scale (i.e., the number of areal units) and spatial configuration of the units used.40 Although, as yet, no solution to the MAUP has been developed, the awareness of its impact on analytical results, the importance of areal unit choice and improved zone design are consistently identified as possible means to reduce the negative impacts of the problem.17,41 The following example illustrates the importance of accounting for spatial scale when mapping trauma.
Spatial epidemiology at work: a preliminary assessment of scale and injury in British Columbia
The spatial dimensions of severe trauma injury in British Columbia
In a mountainous jurisdiction such as British Columbia, the location of geographic barriers (and transportation routes) have heavily influenced settlement patterns.42 Slightly more than half of the province’s population lives within the Vancouver Census Metropolitan Area, as defined by Statistics Canada. Outside the Vancouver area, there are substantial population concentrations in Abbotsford and the Fraser Valley, in southern Victoria and in Kelowna and the Okanagan Valley. The remaining population is dispersed across the rest of the province in communities that are best characterized as rural and remote, and that are typically linked to resource extraction.
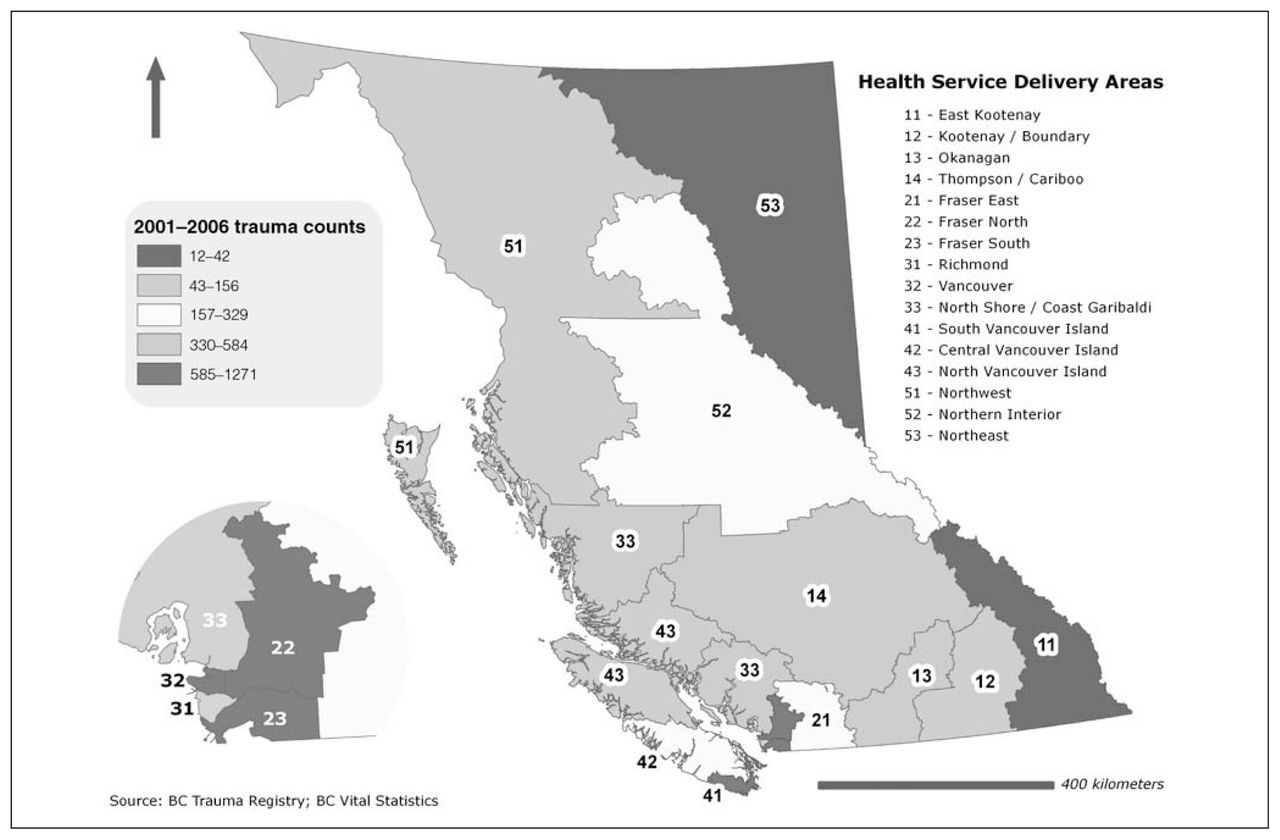
The sociospatial dimensions of trauma in British Columbia can be broadly illustrated by examining distribution at a range of geographical scales including health service delivery areas (HSDAs), census subdivisions (CSDs), urban area census tracts and dissemination areas. Figure 1 illustrates the incidence of trauma for the HSDAs in British Columbia. The HSDAs are intermediate administrative units containing multiple health care facilities that are spatially organized to function as an integrated system, with higher-level services provided by a regional hospital. The HSDAs serve wide range of catchment populations (and population sizes); the largest serves more than a half-million people and the smallest serves slightly more than 60 000. Although useful for the analysis of rare and airborne diseases, injury rates calculated for large administrative areas are problematic because these areas are often poorly representative of the underlying sociodemographic environment.

Trauma incidence by Health Service Delivery Area (HSDA). The general pattern varies based on the geographic unit used (e.g., an area within a specific HSDA may have a higher trauma count).
The CSDs are equivalent in size to a municipality. On average, each HSDA contains more than 40 municipalities, although these numbers are substantially higher in the HSDAs surrounding the Vancouver Census Metropolitain Area and considerably lower for urban and rural centres throughout the interior of the province. The populations of CSDs range from more than 100 000 people in municipalities within British Columbia’s Lower Mainland and the capital district to 1000 people or less in remote regions. Using an approach analogous to a location quotient, Figure 2 reveals the geographic variation of major injury within the HSDAs based on the degree to which the CSD rates differ from the HSDA-wide rate. A number of areas are clearly identified as high-injury areas in which the actual rates of major injury are more than double the HSDA-wide rate.

Location quotients for Health Service Delivery Areas in the province of British Columbia. Note that more rural areas tend to be associated with higher location quotients.
Figure 3 underscores the variation between Figure 1 and Figure 2 by revealing the effect of scale on trauma rates. Use of a larger scale (i.e., smaller area) illustrates more nuanced patterns within HSDAs. As discussed previously, the MAUP is a persistent problem, but not one that should deter analysts from examining trauma in a spatial context. In British Columbia, there is no logical spatial relation between health authority boundaries and census spatial units. The latter, however, frequently encompass too broad an area to be meaningful for spatial analysis. Census spatial units permit a higher-resolution portrayal of rates and are therefore useful for understanding patterns of spatial injury. The examples presented are not designed to be a comprehensive spatial analysis of trauma; rather, they illustrate the potential of GIS as a means to enhance understanding of spatial patterns in trauma.
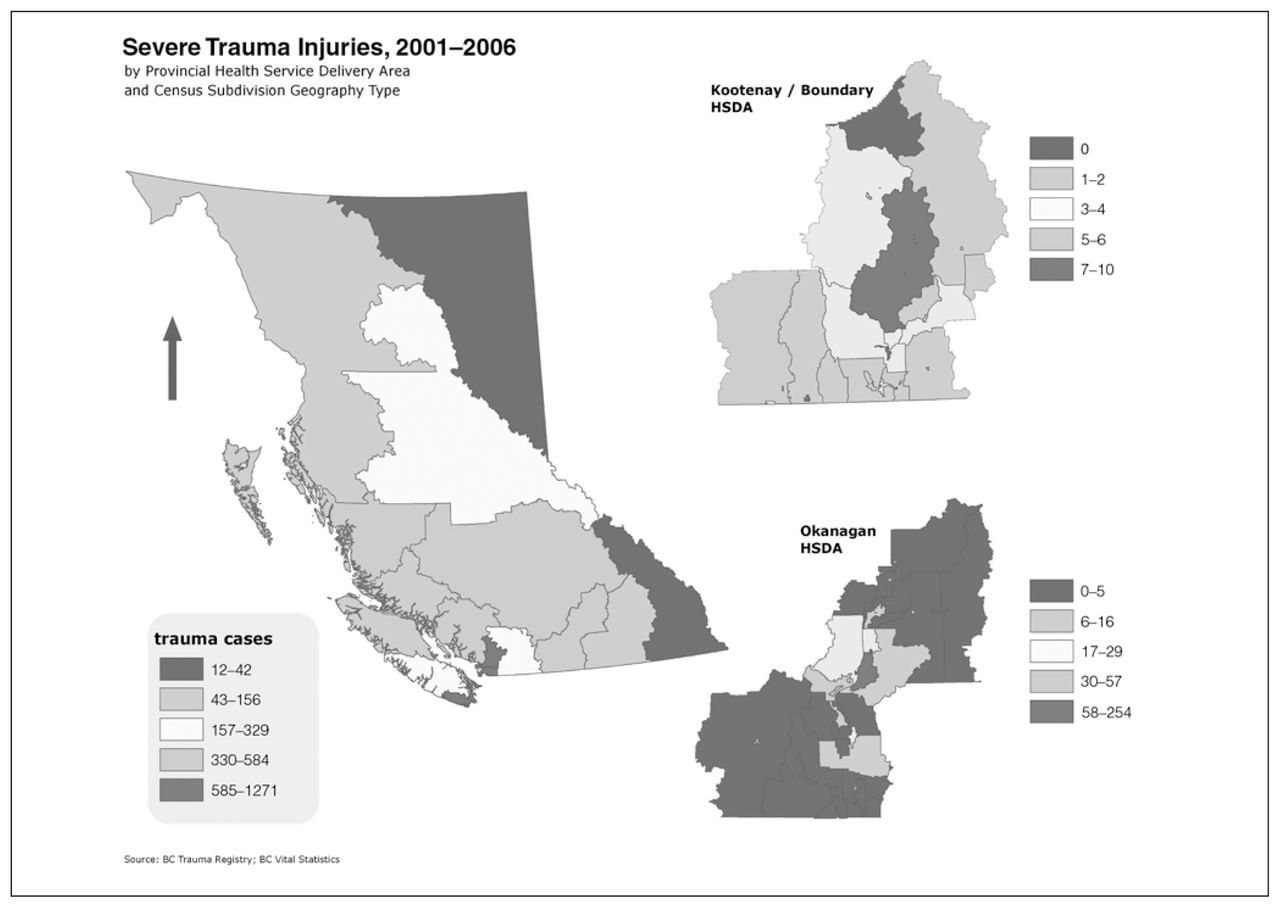
Incidence of severe injury by Health Service Delivery Area (HSDA) and within the Kootenay/Boundary and Okanagan HSDAs. Trauma rates vary widely within HSDAs, thus scale matters — especially when interpreting mapped results.
Discussion and Conclusion
The techniques and theory of GIS offer trauma studies a number of clear benefits, especially in the area of injury surveillance. Here, GIS capabilities could be leveraged to assist researchers and health practitioners to develop a more comprehensive understanding of the risk of trauma and outcome, allowing them to improve access to trauma care, better allocate scarce resources and develop more effective prevention strategies.43,44 We reviewed the current use and promise of GIS techniques in injury control. In addition, we identified a key methodologic concern: the extent to which scale can influence the interpretation of results. Examples from British Columbia illustrate the potential utility of mapping and analyzing trauma at a range of spatial scales.
Acknowledgements
Dr. Schuurman is supported by Canadian Institutes of Health Research (CIHR) grant # IJN-79997 and grant # 116338.
Footnotes
Competing interests: None declared.
Contributors: Drs. Schuurman and Hameed designed the study and acquired the data. Drs. Schuurman, Hameed and Simons, Mr. Fiedler and Mr. Bell analyzed and interpreted the data. Drs. Schuurman and Hameed, Mr. Fiedler and Mr. Bell wrote the article, and Dr. Simons reviewed the article. All authors approved the final version of the article for publication.
- Accepted February 6, 2008.
References
In this issue

Article tools


Related Articles
Cited By...
- No citing articles found.