


Abstract
Objective: To determine if patient satisfaction can be improved by changing patients’ expectations of the clinic visit and by decreasing the total time spent in the clinic.
Design: A prospective comparative analysis carried out in 4 phases.
Setting: An university-affiliated orthopedic outpatient clinic.
Patients: All patients seen in the orthopedic outpatient clinic were eligible. Phase 1 determined the total clinic time required by patient type; phase 2 assessed baseline satisfaction; phase 3 altered patients’ expectations; and phase 4 altered patients’ expectations and scheduled visits by patient type.
Intervention: Patient questionnaires.
Main outcome measure: Patient satisfaction with time spent in the clinic.
Results: Of 708 distributed questionnaires, 622 (88%) were completed (547 totally complete, 75 partially complete). Total time spent in the clinic decreased across phases 2, 3 and 4 (mean 99.2, 94.7 and 85.2 minutes, respectively, but was significantly different only between phases 3 and 4; p = 0.05, Duncan’s multiple range test). The percentage of patients who rated their waiting time as “excellent” increased across phases 2, 3 and 4 (14.6%, 18.8% and 31.1%, respectively; p = 0.0004, χ2 test).
Conclusion: Patient satisfaction can be improved by altering patient expectations and by decreasing the total time spent in clinic.
Satisfaction during a health care encounter is related to the relationship between the patients’ expectations and experiences. Experience with a health care service can have a direct impact on the patient’s expections of that service.1 Although not all patients may have expectations, 2 they refer to what patients think they will receive, what they desire, what they feel to be important or what they feel entitled to when seeking care.3 The relationship between expectations and experience is not always direct, but when experience deviates substantially from expectations, dissatisfaction results.4
Satisfaction is an important outcome of health care. “Client satisfaction is of fundamental importance as a measure of the quality of care because it gives information on the provider’s success at meeting those client values and expectations which are matters on which the client is the ultimate authority.” 5 Furthermore, patient satisfaction with health care is important because it may influence patients’ health-seeking behaviour.6 Satisfied patients are more likely to seek medical advice, comply with treatment recommendations, maintain a specific patient–physician relationship, keep appointments and refer other patients to their physician.6,7
Several factors influence patient satisfaction, including continuity of care (the patient has a regular source of care and sees the same health care provider), the kind and number of diagnostic tests performed, clear communication from the health care provider, empathy of the health care providers, the attitudes of the health care provider(s) toward the patient, accessibility to the service, and time spent in the encounter.6,8 Long clinic visits are typical of many hospital outpatient departments and are a frequent cause of complaints. Patients may become dissatisfied not only when the duration of the appointment is longer than expected but also because they see their physician past the appointment time (owing to time spent in diagnostic imaging or other hospital areas). The purpose of this study was to improve patient satisfaction with the clinic time by changing patients’ expectations of the clinic visit and by decreasing the total time spent in the clinic.
Patients and methods
The study was conducted at the Wellesley Central site of St. Michael’s Hospital between Sept. 15, 1994, and Mar. 30, 1995. The Wellesley Central site of St. Michael’s Hospital is a general hospital affiliated with the University of Toronto. The study was conducted in a weekly orthopedic clinic, which included new patient consultations, management of patients with fractures, and ongoing care of patients with musculoskeletal diseases, such as osteoarthritis and rheumatoid arthritis. The majority of complaints to the hospital regarding the orthopedic clinic centred on long waits in the clinic (unpublished data).
All patients attending the clinic were eligible for the study, including those with scheduled appointments and “add on” patients (persons seen in the emergency room and referred to the clinic for consultation). Patients were excluded if they were mentally or physically incapable of participating, unable to read or comprehend English, or refused to participate. Reasons for exclusion were entered into a rejection log. Clinic staff were blinded to the study design and hypothesis, but were responsible for distributing and collecting satisfaction questionnaires and providing information to patients in the latter half of the study. Immediately after the clinic visit eligible patients rated their satisfaction with time spent in the clinic.9 To maintain patient confidentiality, the questionnaires did not contain any patient identification information. The study protocol was reviewed by an institutional review board.
The study was conducted in 4 phases.
In phase 1, patients were tracked through the clinic from the time of arrival until the time of discharge and categorized by case type. (This information was used to determine the average total clinic time by case type.) This phase ran from Apr. 14 to May 26, 1994, and involved 230 patients in 5 clinics. Patients were classified by type : (1) new and (2) follow-up or fracture, which was subcategorized as (a) requiring cast removal and a radiograph, (b) requiring a radiograph only, (c) requiring cast removal only, and (d) requiring physical examination only.
Phase 2 evaluated the baseline satisfaction of patients in the clinic before any intervention (a “wash-out” period of 3 weeks was allowed between phases to minimize patients being included in more than 1 phase; less than 5% of patients were included in more than 1 phase of the study). Phase 2 ran from Sept. 15 to Oct. 27, 1994, and involved 240 patients in 6 clinics. An initial run-in period from Sept. 1 to Sept. 15, was used to familiarize the staff with providing the questionnaires. The information obtained from these questionnaires, however, was not used in the final analyses. In this phase, patients were provided, as usual, only an appointment time for the clinic visit.
Phase 3 was intended to change patients’ expectations of the visit. This phase ran from Nov. 17, 1994, to Jan. 7, 1995, and involved 255 patients in 7 clinics. Patients were given an estimate of the average total amount of time they should expect to spend in the clinic based on their case type and were informed that their appointment time was the access point into the system (i.e., they may first need to have a cast removed or be sent for a radiograph) not necessarily the time they would see the surgeon. This information was given to the patients at the end of their visit at a prior clinic or they were contacted by telephone before the visit. Add-on patients and those unreachable by phone were informed when they arrived at the clinic.
Phase 4 was intended (in addition to changing patients’ expectations of the visit as in phase 3) to decrease the total time spent in the clinic. This phase ran from Feb. 2 to Mar. 30, 1995, and involved 213 patients in 5 clinics. As in phase 3, patients were informed that their appointment time was the access point into the system (and not necessarily the time they would see the surgeon) and they were given an estimate of the total amount of time they should expect to spend in the clinic. In addition, they were scheduled in the clinic by case type with appointment times for each aspect of their visit (such as arrival, diagnostic imaging, plaster technology) in an attempt to improve the efficiency of the clinic and thereby decrease average clinic time. Patients received this information at the end of their prior visit or by telephone. Add-on patients and those unreachable by phone were informed when they arrived at the clinic.
Attempts were made to track patients chronologically through the clinic with log in–log out forms. These were completed by hand by fracture clinic staff. This attempt was abandoned because the majority of forms were returned incomplete. The volume of patients was too great for the study staff to attend to their usual duties and complete the forms, and the budget did not allow for the hiring of personnel or purchase of technology to track patients accurately with acceptable form completion. Therefore, we could not determine the exact points of delay during the clinic visit, but the most important measure was the overall wait.
The following demographic information was obtained for each patient: the date of the clinic, the anatomic site of the orthopedic problem (hip, knee, hand and wrist, feet, toes, shoulder), the first visit (new patient) or a repeat visit, and the total clinic time (defined as time of arrival at the clinic until time of departure from the clinic).
Patients rated their satisfaction with the clinic time immediately after the clinic visit, answering the question “How do you rate the time you spent in clinic?” taken from Ware’s visit-specific satisfaction questionnaire,8 in the following 5 categories; excellent (5 points), very good (4 points), good (3 points), fair (2 points) or poor (1 point). We chose this single question because it originated from a reliable and valid questionnaire and directly addressed the phenomenon we were trying to measure.
The sample size was based on the hypothesis that each stage would have a “small effect size” (defined by Cohen10 as the difference in satisfaction scores divided by standard deviation of baseline satisfaction) of improvement in satisfaction with the length of wait in the clinic (on the 5-point scale). Assuming an α of 0.05, a β of 0.20 and an effect size of 0.3, a minimum of 175 patients was required for each phase. All results were entered into a file using DBase version 4.0. The data was double-entered by data entry personnel. Data analysis was performed using SAS version 6.4 software (SAS Institute, Cary, NC).
Results
The mean total clinic time by patient type (obtained in phase 1) is shown in Table I. Of 791 patients seen in the clinic during phases 2, 3 and 4, 83 (10.5%) were excluded; physical and mental incapacity accounted for 80% of the exclusions (Table II). The number of exclusions by phase were similar: phase 2, 9.0% (24 of 267), phase 3, 10.2% (29 of 285) and phase 4, 12.3% (30 of 243). Of the remaining 708 study patients, phases 2, 3 and 4 consisted of 240, 255 and 213 patients, respectively. These patients did not differ with regard to mean age, sex or type of patient (new or follow-up/ fracture patient) (Table III).
Patient Types and Mean Expected Total Time Spent in the Orthopedic Clinic
Reasons Why Patients Were Excluded From the Study
Demographic Data for Patients in Phases 2 to 4*
Of the 708 distributed questionnaires, 547 (77.2%) were returned totally complete and 75 (10.6%) were returned partially complete (incomplete demographic information but satisfaction rated) (Table IV). Incomplete in Table IV was defined as any questionnaire returned completely blank with no responses. Thus, of the 708 distributed questionnaires, 622 (547 complete and 75 partially complete) questionnaires were available for statistical analysis.
Questionnaire Completion Rates for Patients in Phases 2 to 4*
The mean total time spent in the clinic was 99.2, 94.7 and 85.2 minutes in phases 2, 3 and 4 respectively (p = 0.001, ANOVA). Only the difference between phases 3 and 4 was statistically significantly different (p = 0.05, Duncan’s multiple range test ).
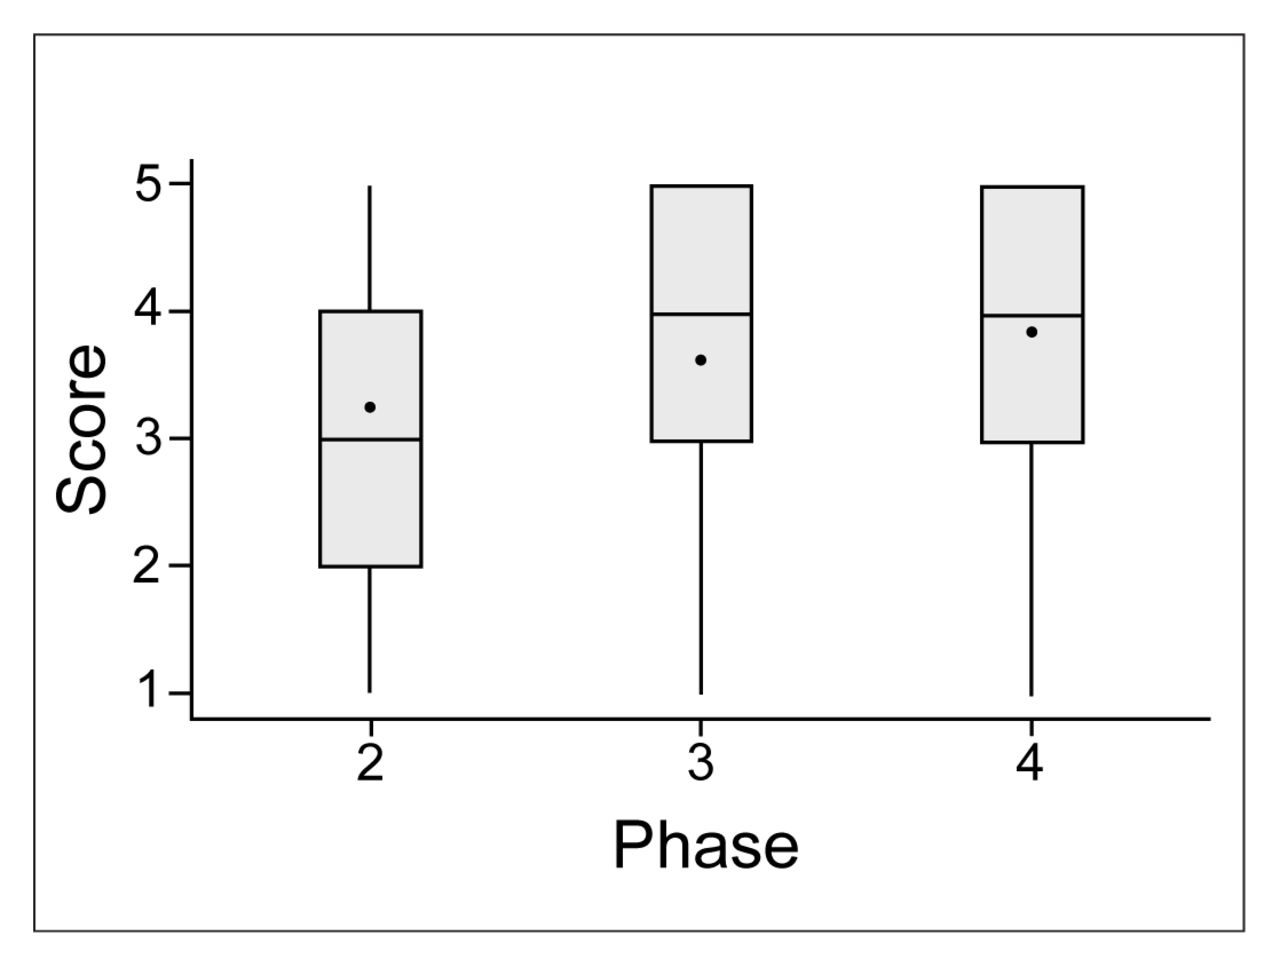
Fig. 1 shows the change in responses to the question “How do you rate the time you spent in the clinic?” across phases 2, 3 and 4. The percentage of patients who rated their satisfaction with clinic time as “excellent” increased from phases 2 to 4 (14.6%, 18.8%, and 31.1% respectively; p = 0.00004, χ2 test). The mean scores for the satisfaction question were 3.3, 3.6, and 3.9 in phases 2, 3 and 4 respectively (p = 0.0001, Kruskal–Wallis test). The satisfaction with clinic time remained statistically significant across phases 2 and 4 even after adjustment for age, gender and total clinic time (p = 0.001, ANCOVA). The differences in satisfaction were significantly different across all 3 phases (p = 0.05, Duncan’s multiple range test).

Patient ratings for satisfaction with time spent in the clinic for phases 2 to 4. Mean scores are indicated by black circles, median scores by the horizontal line in each box. The upper and lower ends of each box represent the 25th and 75th percentiles, respectively and the whiskers indicate 1.5 ′ interquartile range.
Discussion
Clinic time is generally acknowledged as a major source of patient dissatisfaction with outpatient visits. Significant research has been devoted to measuring satisfaction and establishing the determinants of satisfaction, 7,11,12 but relatively little attention has been directed to improving satisfaction. 6 We performed a MEDLINE review from 1966 to June 1997 using the MeSH headings “acceptance of health care” (which includes subheadings “consumer satisfaction” and “patient satisfaction) and “appointment and schedules” and “ambulatory care facilities.” The majority of the 129 identified articles focused on patients’ overall satisfaction with care, with their appointment time and with the effect of satisfaction on keeping appointments or complying with treatments. Despite numerous articles commenting on the adverse effect of clinic time on patient satisfaction,13–17 only 3 studies have evaluated methods to reduce clinic times (by appointing a staff physician as clinic director,18 by staffing and facility changes19 or by implementing a centralized appointment system20), and none of these studies evaluated or attempted to improve patients’ satisfaction with clinic times.
Several factors may decrease patients’ satisfaction with the total clinic time. First, many patients arrive at the clinic expecting to see their physician at the prearranged appointment time. However, many undergo additional procedures or investigations (radiography, cast removal, blood tests, and others), before being seen by the physician. Second, many patients arrived at the clinic early in the morning with the unrealistic expectation that the clinic operates on a first come, first served basis. Third, patients’ total clinic time was often longer than anticipated. Because satisfaction with care relates to the relationship between expectation and experience, this study used a 2-stage intervention designed to improve patient satisfaction with time spent in an outpatient clinic: first, changing patient expectations of the visit and, second, improving patient experience by decreasing the total clinic time.
The first stage of the intervention was intended simply to change expectations by communicating to patients the total time they should expect to spend in the clinic and to give them a time breakdown of whom they would see and when. The intent was that patients would arrive at the clinic with more realistic expectations. Although the average total clinic time did decrease from phase 2 to phase 3 by 4.5 minutes (which might partially account for the improved satisfaction in phase 3), the difference in time between phases 2 and 3 was not significantly different. Furthermore, even after adjustment for clinic time in the ANCOVA analysis, the improvement in satisfaction between phases 2 and 3 remained significantly different. Thus, simply changing patients’ expectations improved satisfaction, despite a visit time of approximately 90 minutes. Although this may seem like an intuitive result, the finding is important for 2 reasons. First, despite the intuitive nature of this finding, in our experience patients are seldom (if ever) given realistic expectations in clinic settings. Second, simply informing patients is an easy intervention that requires minimal effort and no change to clinic scheduling.
The second stage of the intervention was intended to improve the efficiency of patients’ visits, decrease clinic time, and thereby, further improve satisfaction. To provide more efficient scheduling, patients were booked into the clinic according to the patient type (time required for services) to prevent overbooking. This prevented, for example, 5 “new” patients each requiring on average 1.8 hours of clinic time arriving to the clinic at the same time. When insufficient time was available to service a patient’s needs in a certain clinic, the patient was given an appointment in the next available clinic. The total clinic time was the time from arrival until the time of discharge, but because the tracking sheet documented only the time the patient left the clinic (to receive other services such as radiography, orthotics consultations, have a cast applied or removed) and returned to clinic, an exact breakdown of time outside the clinic was not possible, so the exact point at which decreases in clinic time were generated could not be ascertained. Although a decrease in clinic time leading to improvement in patient satisfaction is not surprising, this finding has not been studied. We found that a relatively modest improvement in mean clinic time of only 10 minutes resulted in a significant increase in satisfaction.
The 2-stage intervention improved satisfaction with time spent in clinic by 0.6 points on the 5-point ordinal response scale across the 3 phases. This would constitute a “moderate” effect size according to Cohen.10 Furthermore, Jaeschke and associates21 suggested that 0.5 points was the minimal clinically important difference on 7-point ordinal health status questionnaires. Thus, the 0.6 point improvement on a 5-point scale would qualify as a statistically and clinically important change by these standards. Moreover, the percentage of patients who rated their satisfaction with clinic time as “excellent” increased from 14.6% to 31.1% from phase 2 to phase 4.
The study has 3 potential limitations. First, it was not conducted as a randomized clinical trial considered the standard evaluation of an intervention. We could not use a randomized trial because with such a design we would have been unable to control contamination between patients (i.e., patients randomized to receive information about their visit talking with nonrandomized patients, thereby limiting the validity of a randomized trial) and because the second stage of the intervention in phase 4 (designed to decrease clinic time) was directed to the entire clinic, so we could not randomize individual patients. Thus, we used a prospective comparative analysis.
The second limitation was that demographic information was not available on the nonrespondents. The demographic questions were contained within the questionnaire, so if the patients did not complete the questionnaire, this information was not recorded. Thus, we could not compare respondents and nonrespondents with respect to age and sex. However, the characteristics of the respondents were similar across phases 2, 3 and 4, and the numbers and reasons for exclusion were relatively constant across all 3 phases. The main reason for not completing questions was inability due to mental or physical incapacity or inability to read English; only 1% of the participants actually refused to complete the questionnaire.
Finally, this study was performed only on orthopedic patients, which may limit the generalizability of the results. We chose a single subspecialty clinic to minimize the effect of different surgeons and patient types on patient satisfaction. We have no reason to believe that the results of this study would not be applicable to other types of outpatient clinics.
In conclusion, patient satisfaction with the clinic time in an outpatient clinic can be improved by changing patients’ expectations of the appointment and by decreasing their clinic time.
Acknowledgments
We thank the following employees of the Wellesley Central Out-Patient Fracture Clinic who participated in the study design and distribution and collection of questionnaires: Lynda Croth, Helen Georgantonis, Diane Cotter, Andrew Haze and Romeo Fernandez. We also thank Derek Stephens, biostatician, and Claire Milne, data entry clerk, for their contributions to the study.
Dr. Levesque was supported by the Surgical Scientist Program, University of Toronto. Dr. Wright is supported as a Canadian Institutes of Health Research Investigator.
Footnotes
Presented in part at the meeting of the American Federation of Clinical Research, Washington, May 6, 1996.
- Accepted May 11, 2000.
References
In this issue

Article tools


Related Articles
Cited By...
- No citing articles found.